Infographics come in all shapes and sizes. Some are more whimsical and illustrative, while others take a more simplified format. No matter what type of infographic you choose to use, all can help convey a message to your audience in a visually interesting way.
Some of the benefits of using an infographic include:
- Capture a reader’s attention quickly
- Help break up text-heavy reports
- Succinctly convey your message
- Easily repackaged and shared across various platforms
- Useful tool to convey financial information and statistics
- Serve as a portal to additional information
If you’re looking to create a cost effective graphic that’s more visually appealing than simply presenting a spreadsheet, you can go the route of a pie chart, bar graph or scatter graph. Data-heavy information translates well in this format and makes complex information more easily digestible for your audience.
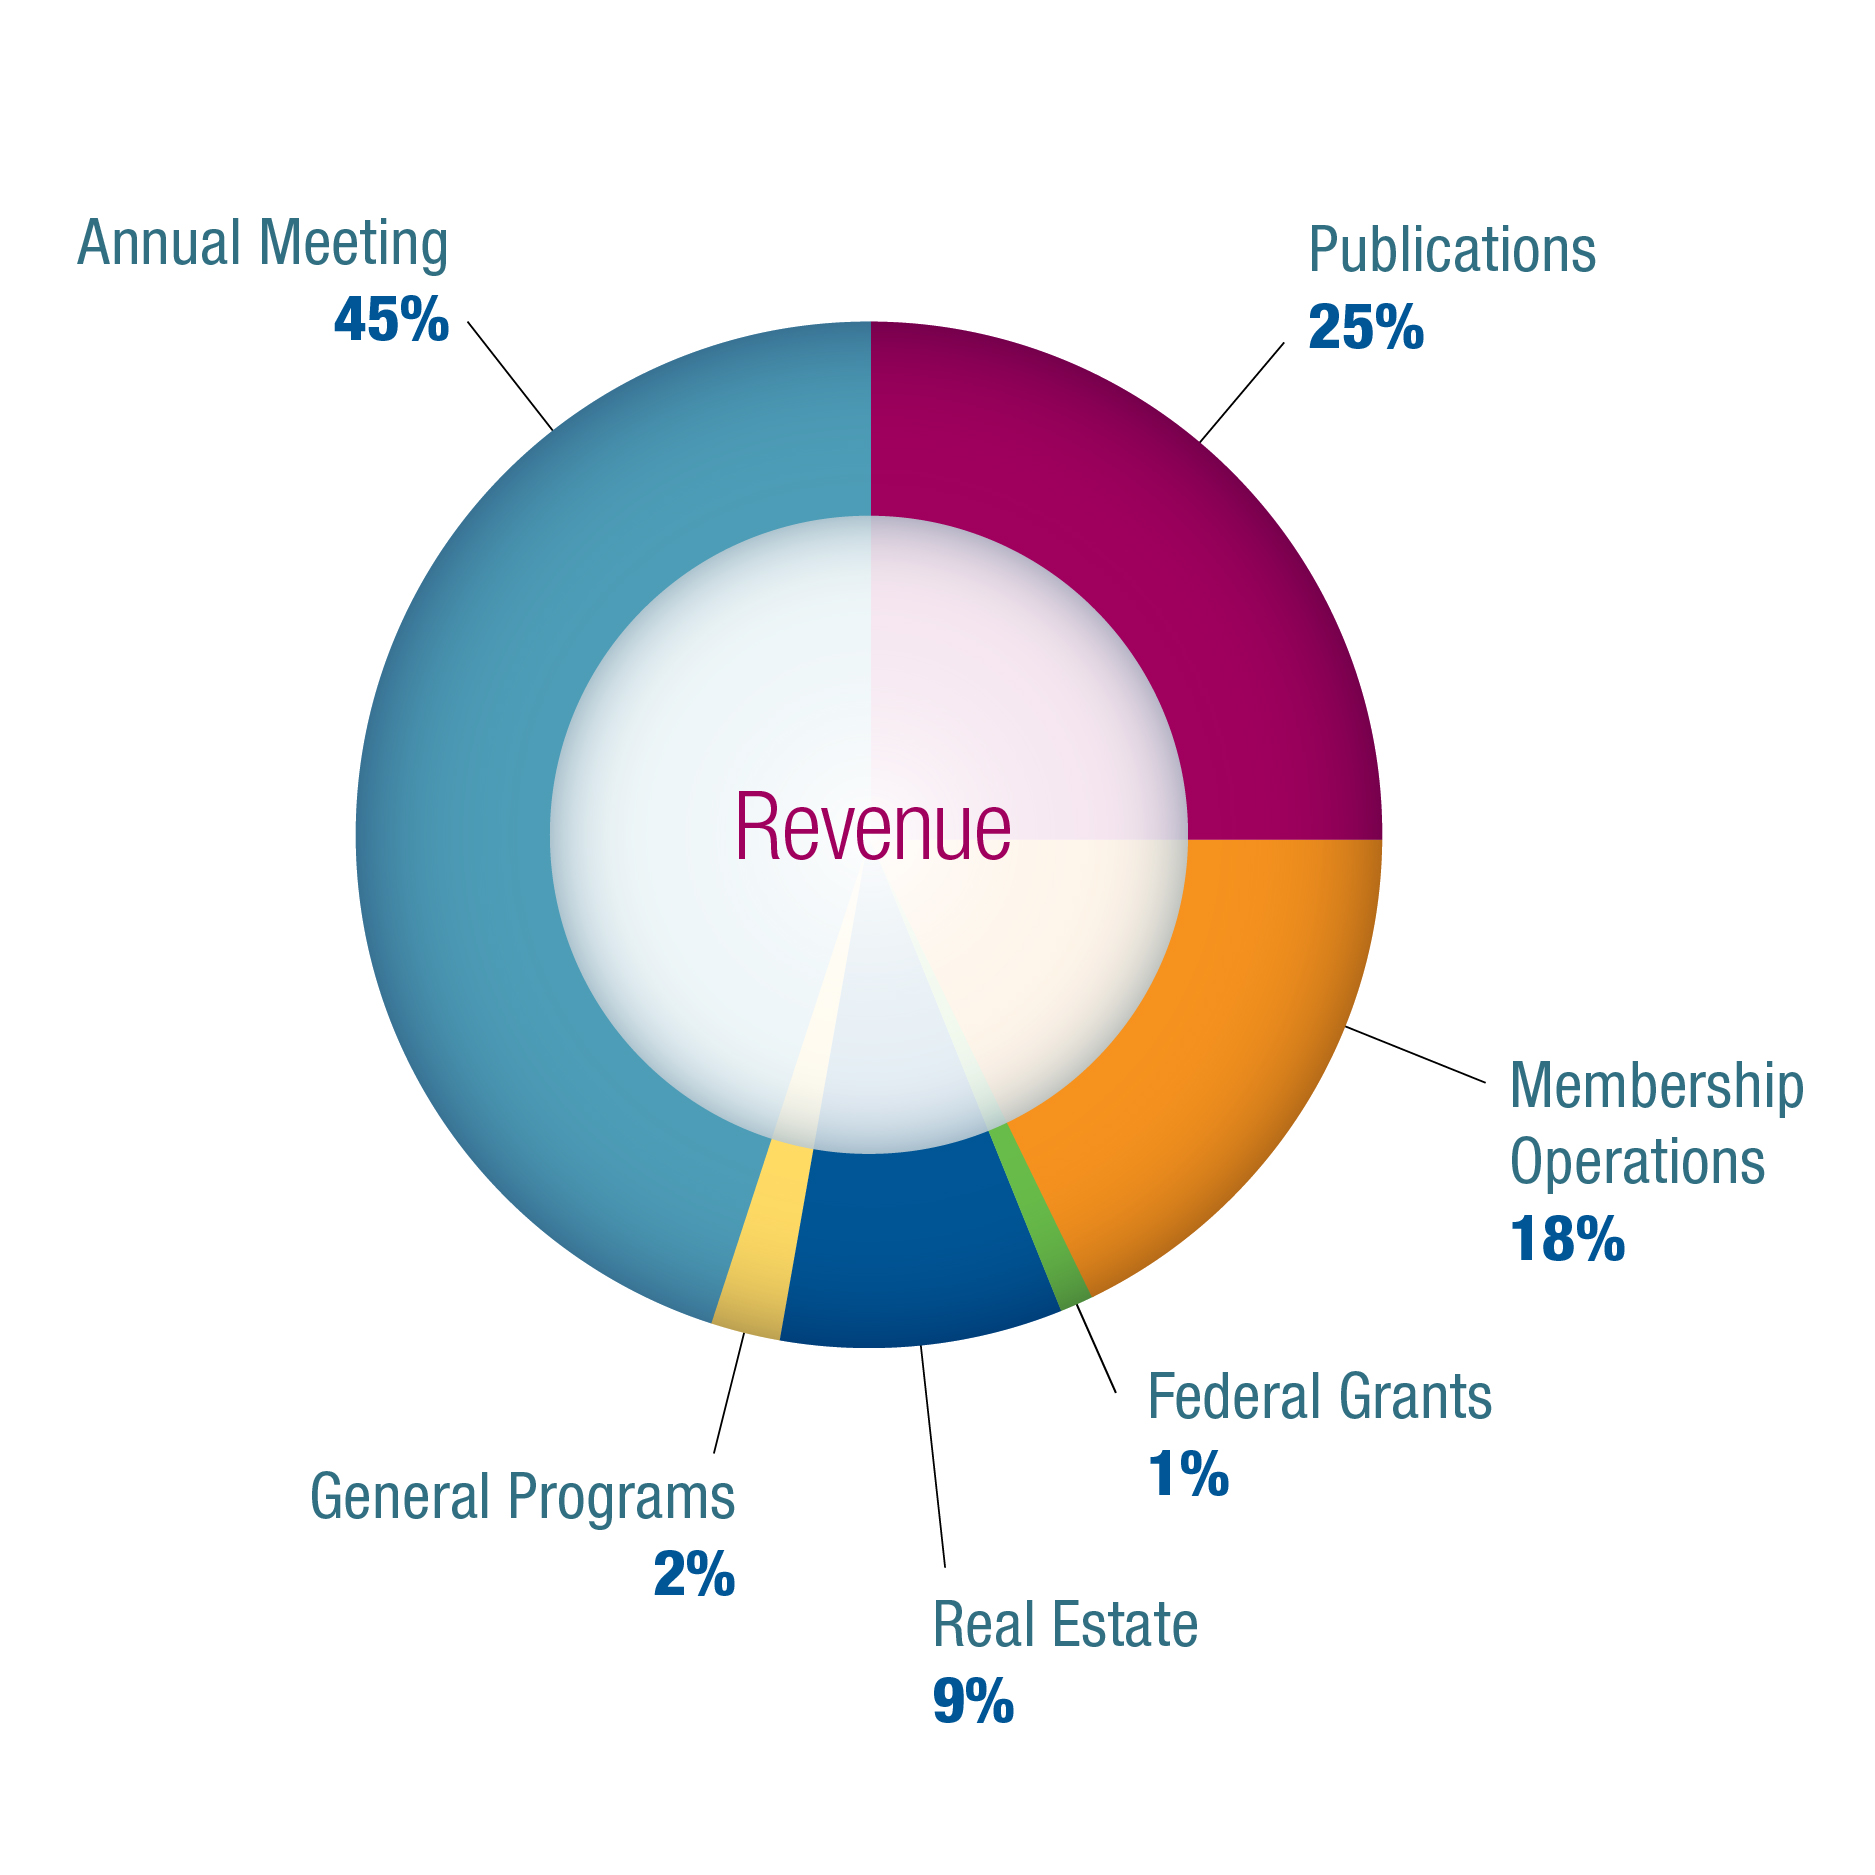
This type of infographic is also an engaging tool for a nonprofit organization striving to be financially transparent to donors without having the reader dig through a spreadsheet.
On the opposite end of the spectrum is the more illustrative infographic that takes what could be considered “dry” data and makes it come alive through illustrations, comparisons, telling a story or explaining a process.
For example, in this infographic from their annual data report, Ocean Conservancy visually shows the audience the story of how sea life is affected by trash.
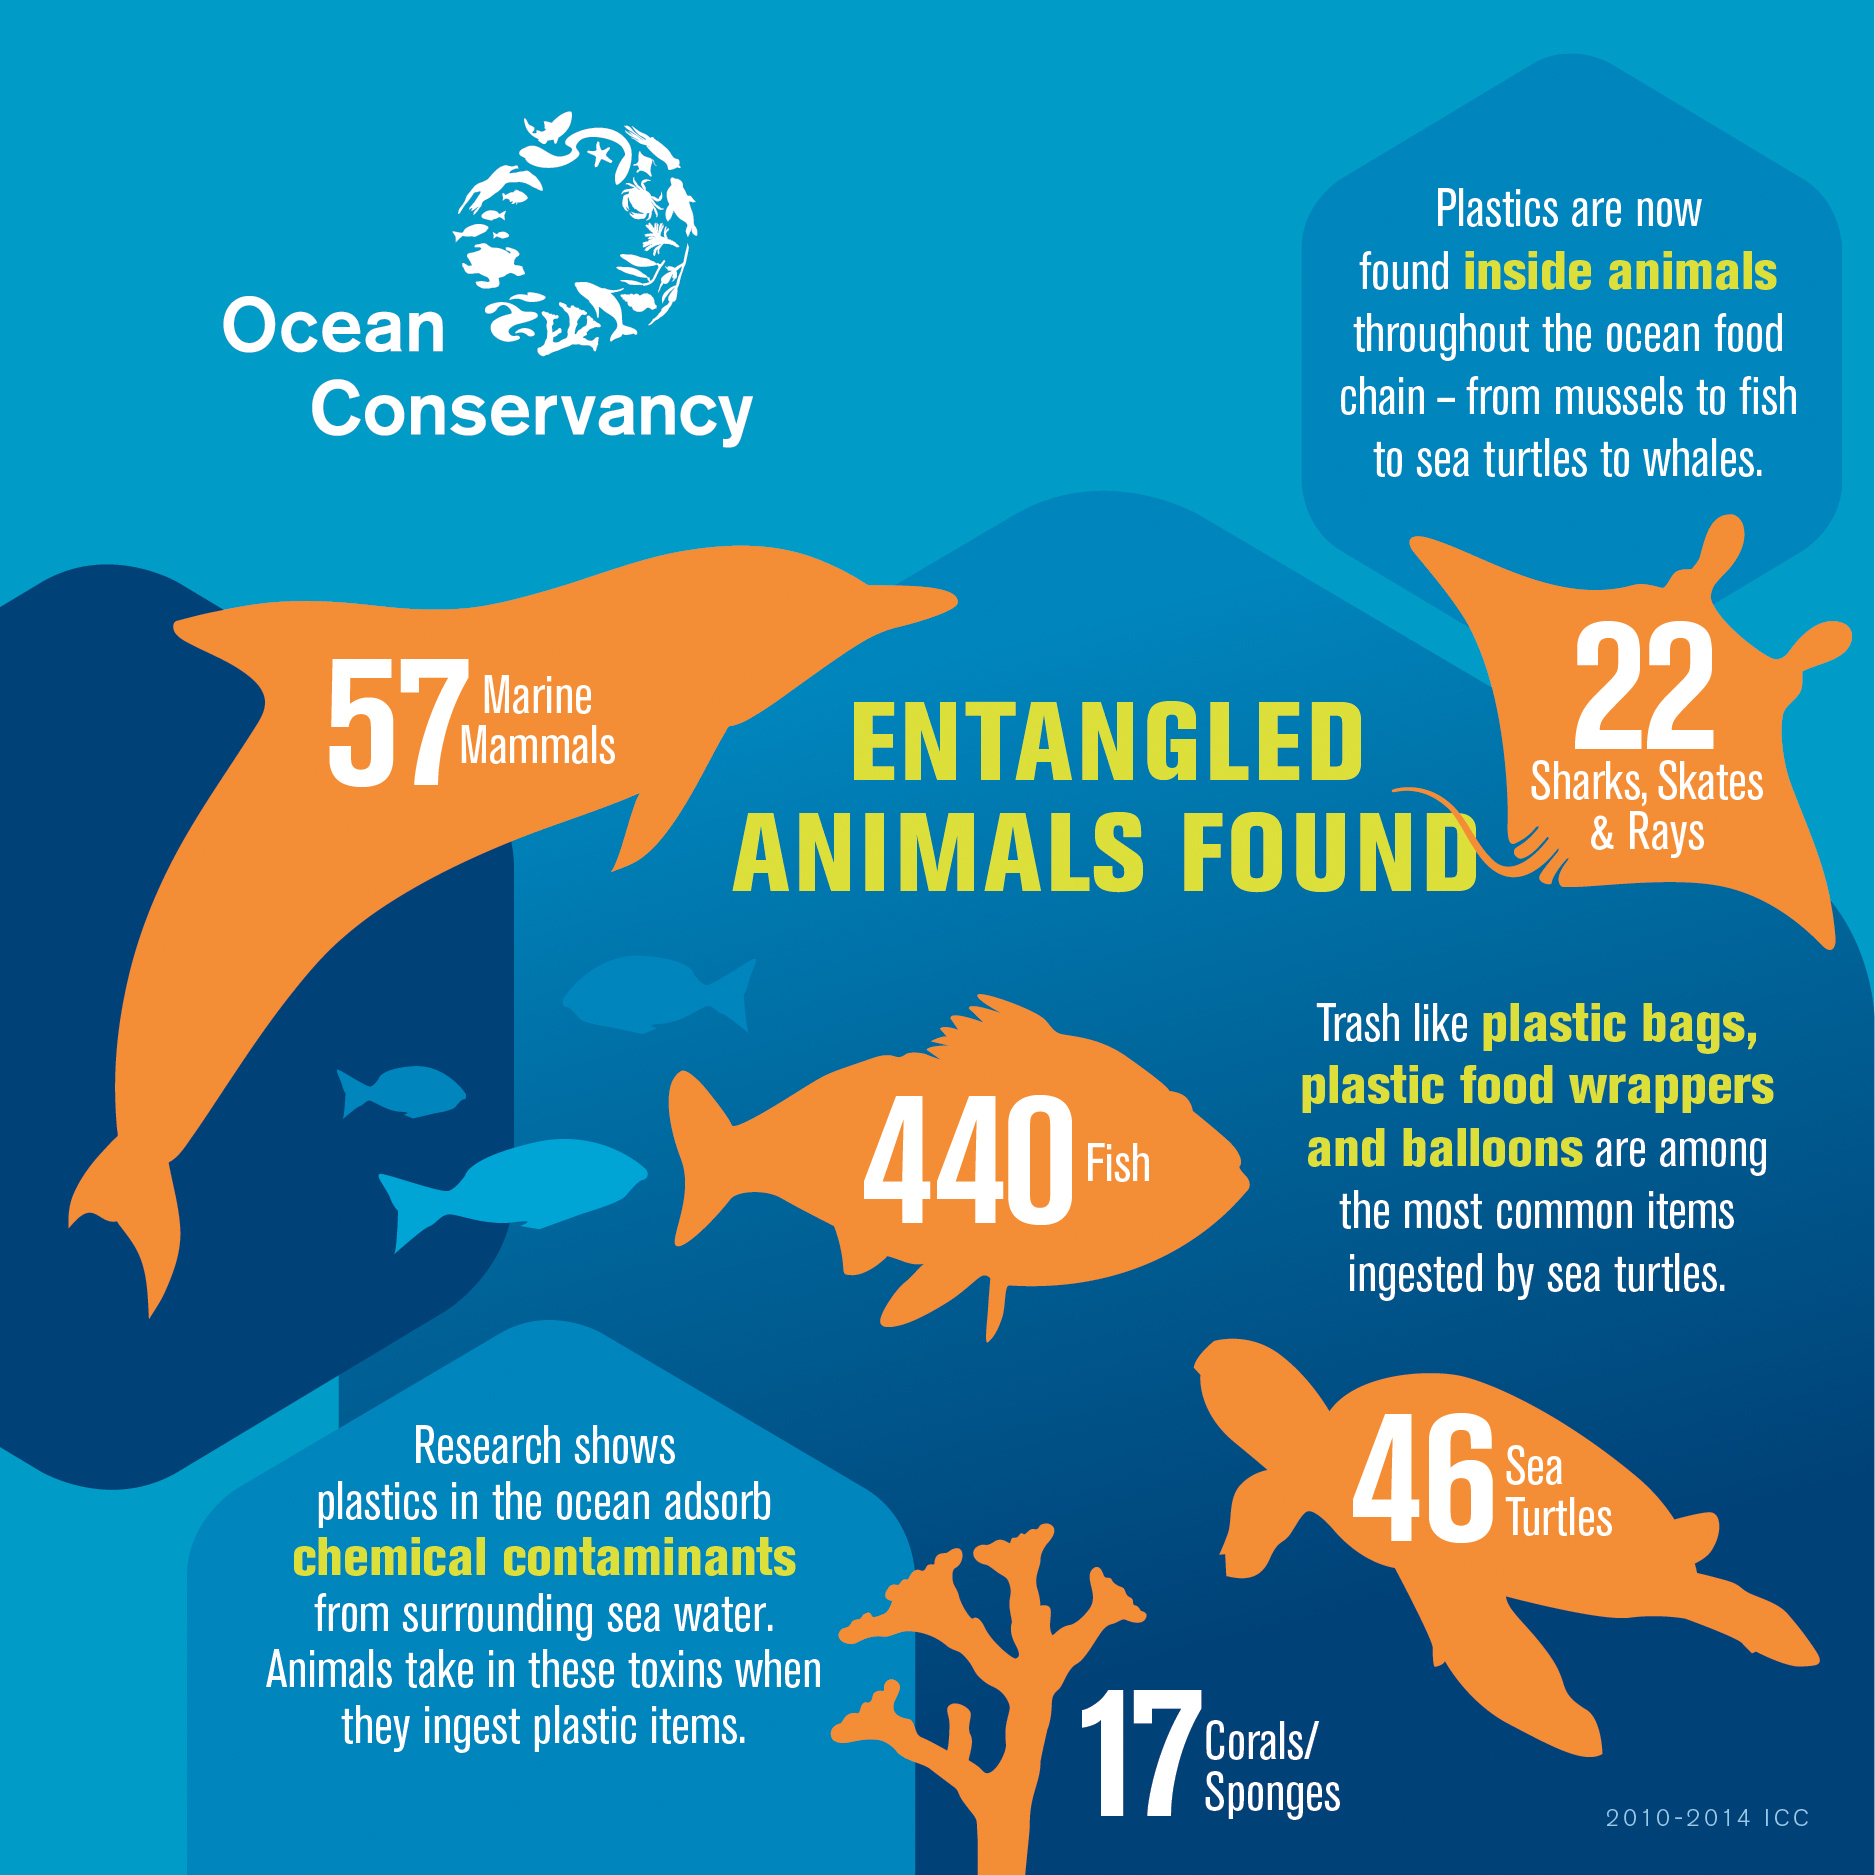
This type of narrative creates more of an emotional appeal, which is an effective way of reaching the Ocean Conservancy audience.
Whether you’re creating a data-driven graphic or one that is more of a emotional narrative, it’s important to focus on color contrast, clarity and simplicity to ensure it is easily accessible. Creating a successful infographic for print, a website, social media or a mobile platform means knowing your audience and being clear in the message you’re trying to communicate.
Looking for some help in creating infographics for your organization? Call Dever Designs at 301-776-2812.